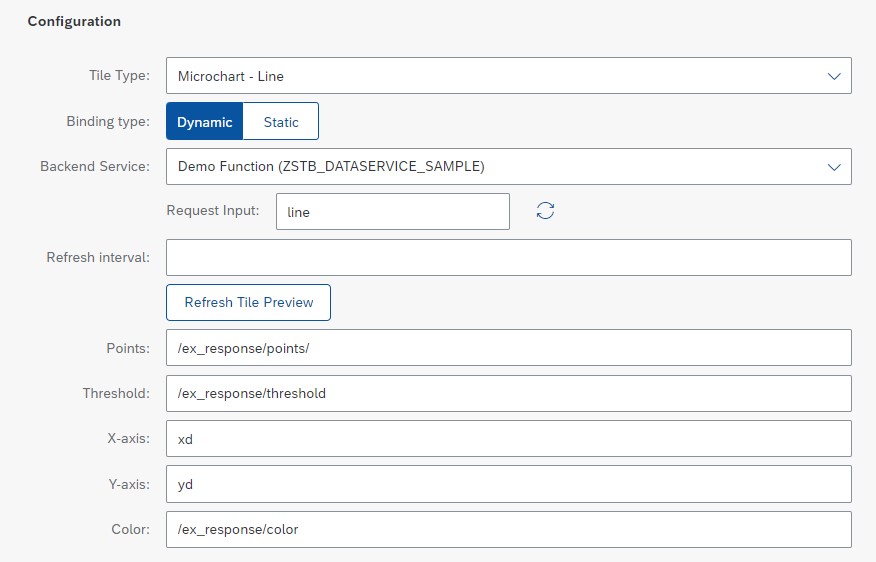
Configuring Tilebuilder Tiles
Sample code for KPI tile and Microchart tiles is supplied in function module /STB/DATASERVICE_SAMPLE.
Clone this function module and add your own business logic to fill the tiles with dynamic data.
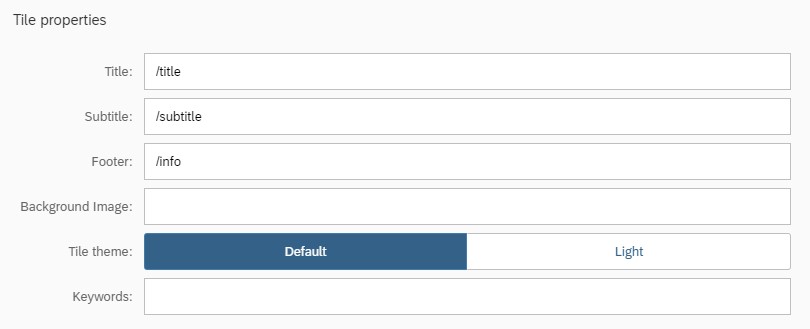
Static Tiles
Static tiles can include title, subtitle and footer texts, a header image or icon, an icon field in the content, and a background image.
Although no dynamic data is included in the tile, all the content can be dynamically determined based on a Tilebuilder function: The images, texts and icons can all change based on back-end logic.

When an icon is included as the tile content (below the header section) the tile mode must be set to 'Content'
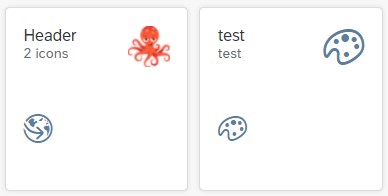
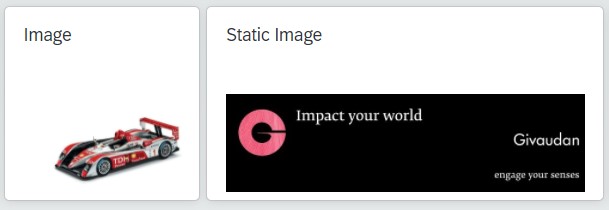
Image tiles
Image tiles include a URL field to show an image as the tile content (i.e. below the header)
The tile mode should be set to 'Content'
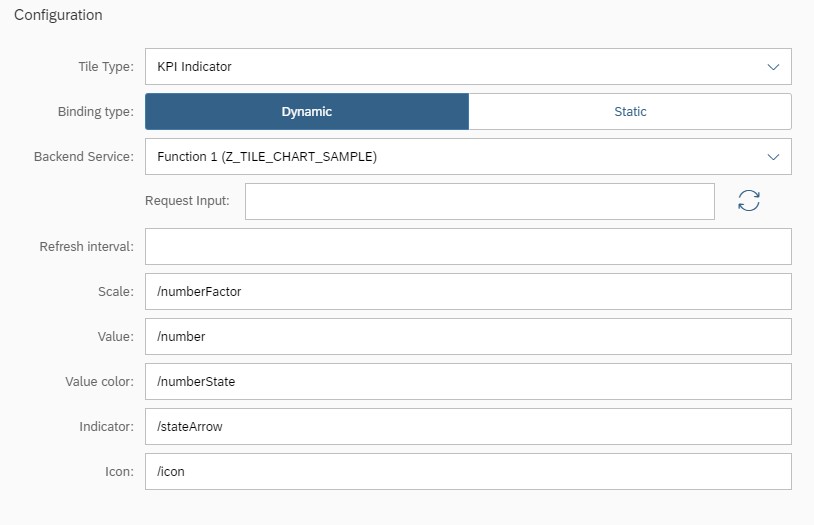
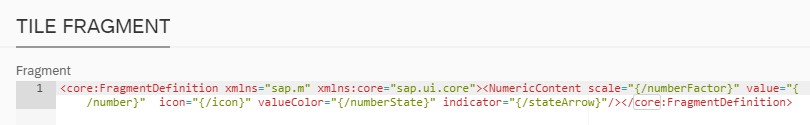
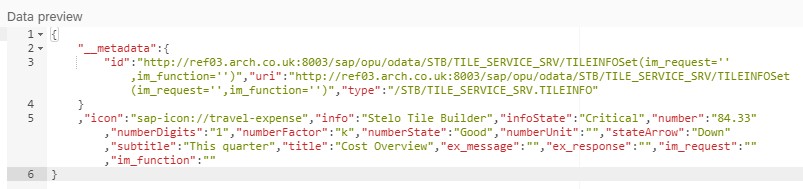
KPI tiles
KPI tiles include scale, value, colour, indicator and icon fields, all of which can be determined dynamically
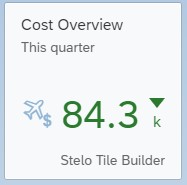
Function Module Code:
1: 2: 3: 4: 5: 6: 7: 8: 9: 10: 11: |
ex_tileinfo-icon = 'sap-icon://travel-expense'. ex_tileinfo-info = 'Stelo Tile Builder'. ex_tileinfo-infostate = 'Critical'. ex_tileinfo-number = '84.33'. ex_tileinfo-numberdigits = '1'. ex_tileinfo-numberfactor = 'k'. ex_tileinfo-numberstate = 'Positive'. ex_tileinfo-numberunit = 'GBP'. ex_tileinfo-statearrow = 'Down'. ex_tileinfo-subtitle = 'This quarter'. ex_tileinfo-title = 'Cost Overview'. |
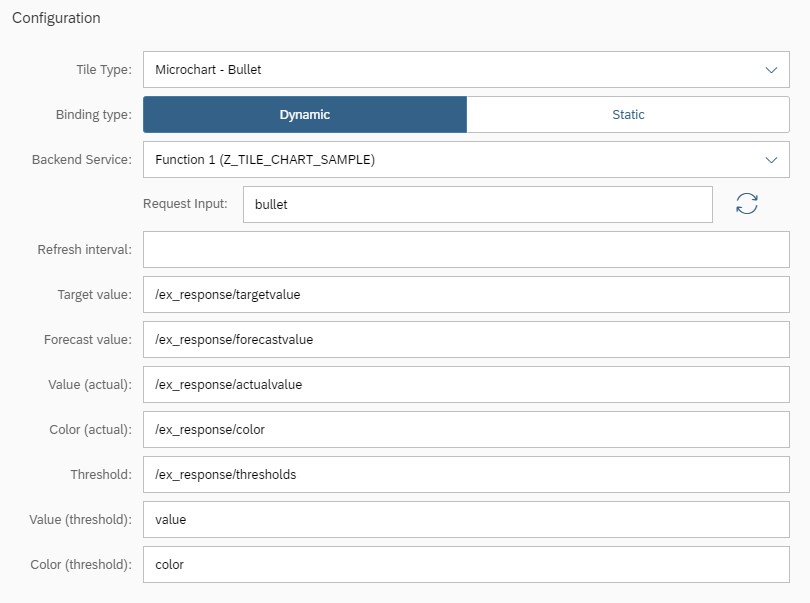
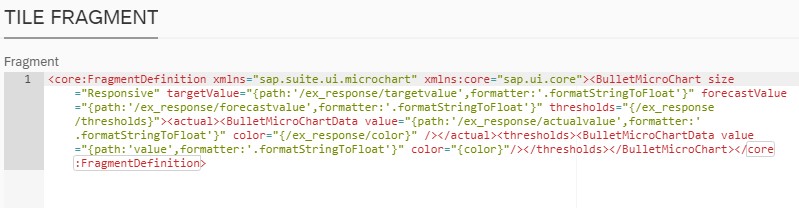
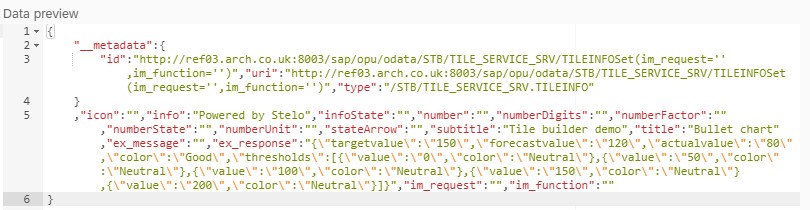
Bullet Microchart
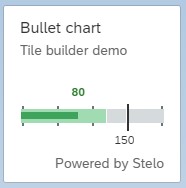
Function Module Code:
1: 2: 3: 4: 5: 6: 7: 8: 9: 10: 11: 12: 13: 14: 15: |
ls_bullet-targetvalue = '150'. ls_bullet-forecastvalue = '120'. ls_bullet-actualvalue = '80'. ls_bullet-color = 'Good'. ls_col_data-value = '0'. ls_col_data-color = 'Neutral'. APPEND ls_col_data TO ls_bullet-thresholds. ... ls_col_data-value = '200'. ls_col_data-color = 'Neutral'. APPEND ls_col_data TO ls_bullet-thresholds. lv_json = /ui2/cl_json=>serialize( data = ls_bullet compress = abap_true ). ex_response = lv_json. |
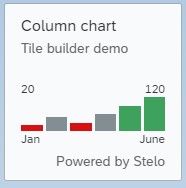
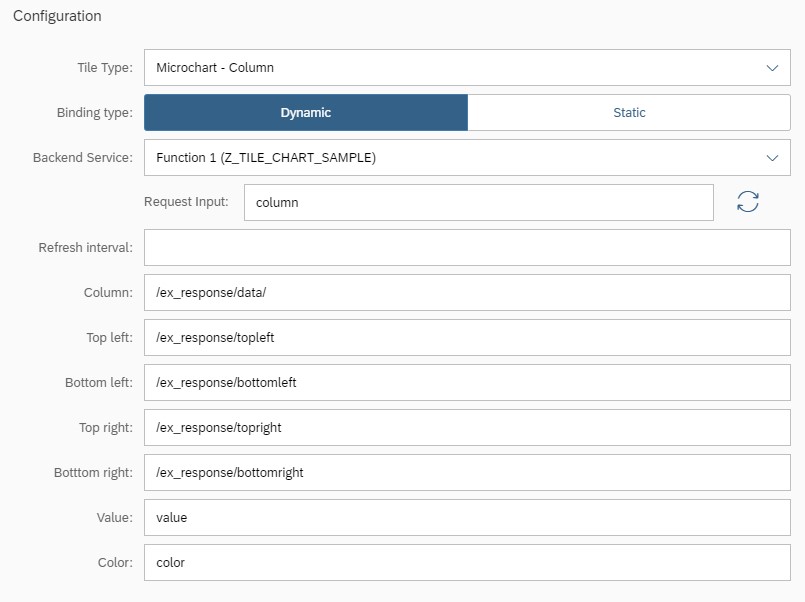
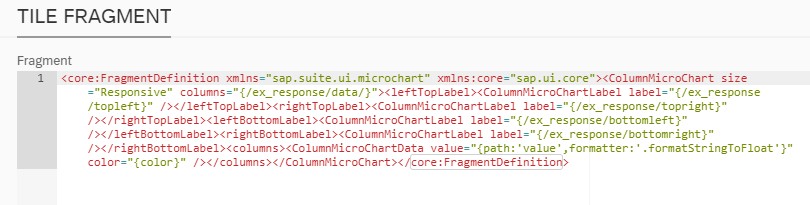
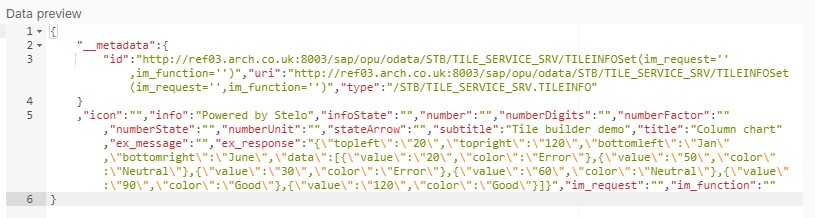
Column Microchart
Function Module Code:
1: 2: 3: 4: 5: 6: 7: 8: 9: 10: 11: 12: 13: |
ls_column-topleft = '20'. ls_column-topright = '120'. ls_column-bottomleft = 'Jan'. ls_column-bottomright = 'June'. ls_col_data-value = '20'. ls_col_data-color = 'Error'. APPEND ls_col_data TO ls_column-data. ls_col_data-value = '50'. ls_col_data-color = 'Neutral'. APPEND ls_col_data TO ls_column-data. ... lv_json = /ui2/cl_json=>serialize( data = ls_column compress = abap_true ). ex_response = lv_json. |
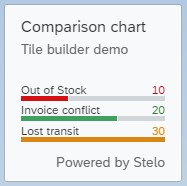
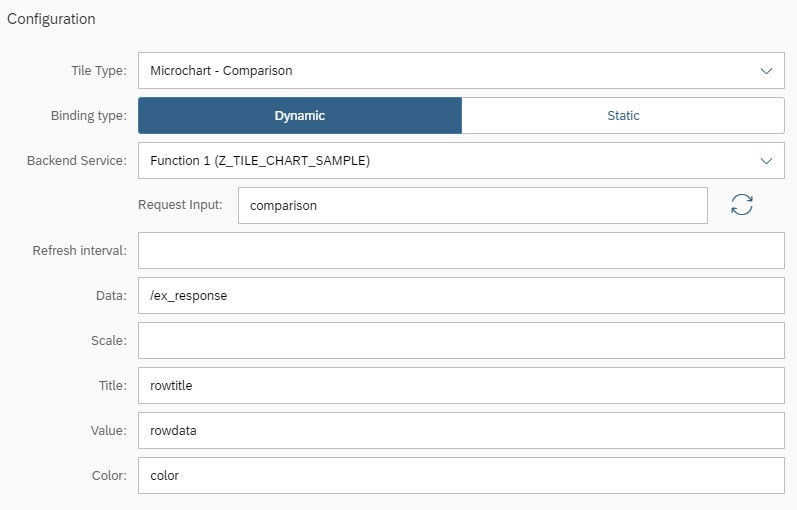
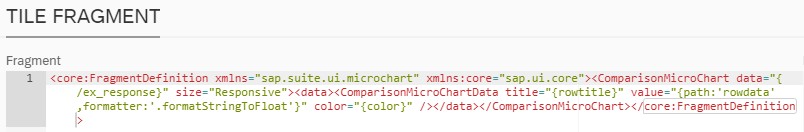
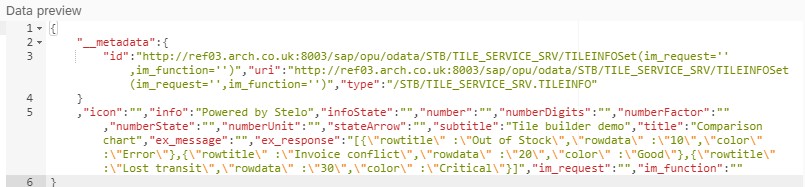
Comparison Microchart
Function Module Code:
1: 2: 3: 4: 5: 6: 7: 8: 9: 10: 11: 12: 13: 14: 15: 16: 17: |
ls_comparison-title = 'Region 1'. ls_comparison-value = '137'. ls_comparison-color = 'Good'. APPEND ls_comparison TO lt_comparison. ls_comparison-title = 'Region 2'. ls_comparison-value = '72'. ls_comparison-color = 'Error'. APPEND ls_comparison TO lt_comparison. ls_comparison-title = 'Region 3'. ls_comparison-value = '156'. ls_comparison-color = 'Critical'. APPEND ls_comparison TO lt_comparison. lv_json = /ui2/cl_json=>serialize( data = lt_comparison compress = abap_true ). ex_response = lv_json. |
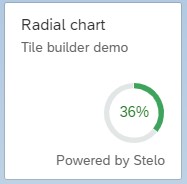
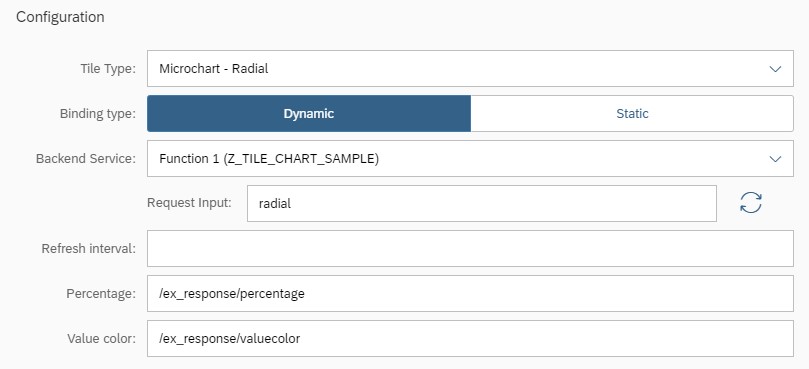
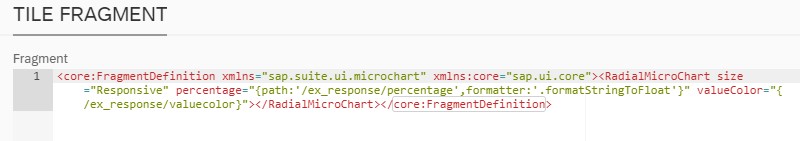
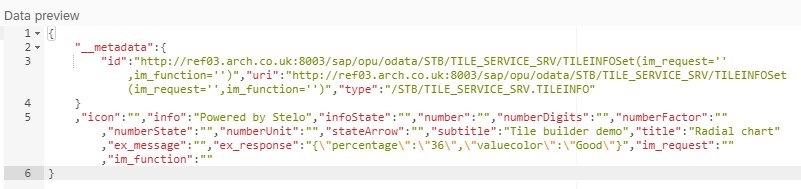
Radial Microchart
Function Module Code:
1: 2: 3: 4: 5: 6: |
ex_tileinfo-icon = 'sap-icon://travel-expense'. ls_radial-percentage = '36'. ls_radial-valuecolor = 'Good'. lv_json = /ui2/cl_json=>serialize( data = ls_radial compress = abap_true ). ex_response = lv_json. |
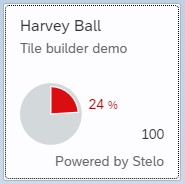
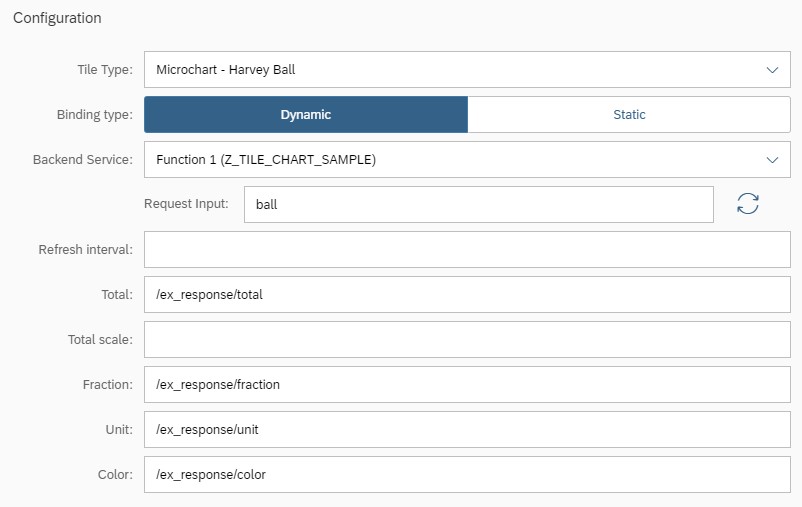
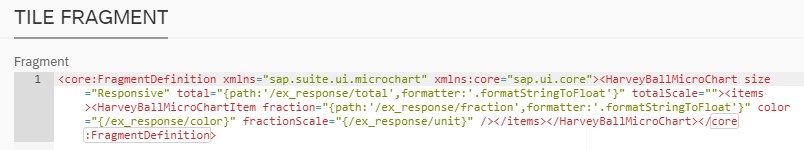
Harvey Ball Microchart
Function Module Code:
1: 2: 3: 4: 5: 6: 7: 8: |
ls_ball-total = '100'. ls_ball-totalscale = ''. ls_ball-fraction = '24'. ls_ball-unit = '%'. ls_ball-color = 'Error'. lv_json = /ui2/cl_json=>serialize( data = ls_ball compress = abap_true ). ex_response = lv_json. |
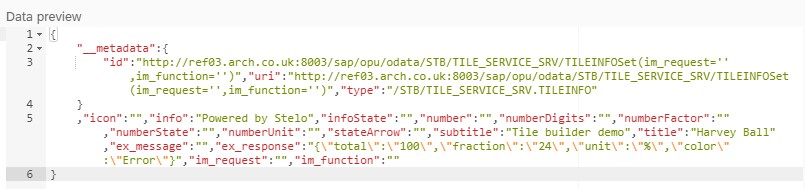
Line Microchart
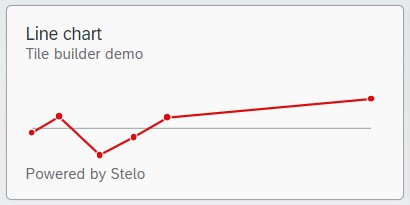
Function module code:
1: 2: 3: 4: 5: 6: 7: 8: 9: 10: 11: 12: 13: 14: 15: 16: 17: 18: 19: 20: 21: 22: 23: 24: 25: 26: 27: 28: 29: 30: 31: 32: 33: 34: 35: 36: 37: 38: 39: 40: 41: 42: 43: 44: 45: 46: 47: 48: 49: 50: 51: 52: 53: 54: |
**--------------------------------------------------------------------* ** Line MicroChart **--------------------------------------------------------------------* * TYPES: BEGIN OF ty_points, * xd TYPE string, * yd TYPE string, * END OF ty_points. ** * DATA: ls_points TYPE ty_points, * lt_points TYPE TABLE OF ty_points. ** * TYPES: BEGIN OF ty_line, * threshold TYPE string, * color TYPE string, * points LIKE lt_points, * END OF ty_line. ** * DATA: ls_line TYPE ty_line. **--------------------------------------------------------------------* * ex_tileinfo-info = 'Powered by Stelo'. * ex_tileinfo-subtitle = 'Tile builder demo'. * ex_tileinfo-title = 'Line chart'. ** * ls_line-threshold = '40'. * ls_line-color = 'Error'. ** * ls_points-xd = '0'. * ls_points-yd = '35'. * APPEND ls_points TO ls_line-points. ** * ls_points-xd = '8'. * ls_points-yd = '53'. * APPEND ls_points TO ls_line-points. ** * ls_points-xd = '20'. * ls_points-yd = '10'. * APPEND ls_points TO ls_line-points. ** * ls_points-xd = '30'. * ls_points-yd = '30'. * APPEND ls_points TO ls_line-points. ** * ls_points-xd = '40'. * ls_points-yd = '52'. * APPEND ls_points TO ls_line-points. ** * ls_points-xd = '100'. * ls_points-yd = '73'. * APPEND ls_points TO ls_line-points. ** ** Convert internal table to json string * lv_json = /ui2/cl_json=>serialize( data = ls_line compress = abap_true pretty_name = /ui2/cl_json=>pretty_mode-low_case ). * ex_response = lv_json. |
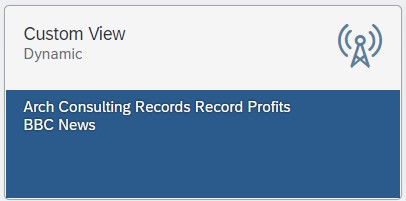
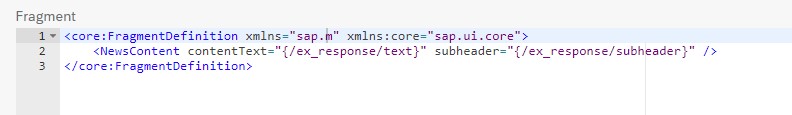
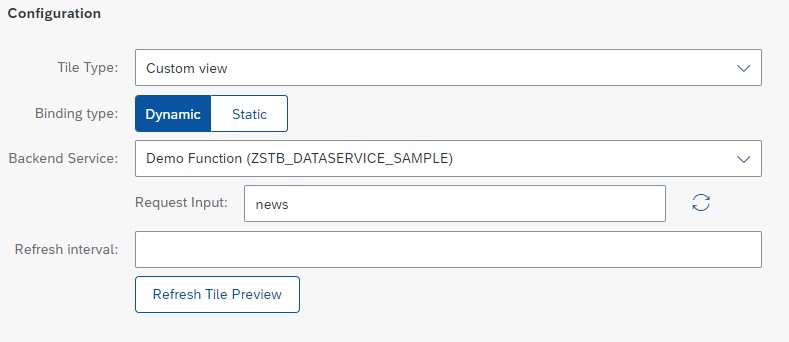
Custom tile
Add your own SAPUI5 code for custom tiles
Here is an example of a news tile: